Archive for the ‘Software Applications’ Category.

We are already in the age of Microlibraries

Early developers spoke of the ability to create small building blocks of code, and to reuse code over and over. This has happened. The proof is seen in many languages. In C# (dotnet), NuGet packages are used over and over again. In Javascript, npm loads thousands of libraries for any given web project.

However, there has been another move in this area that is beneficial that many people haven’t really taken the time to define. This is the move to microlibraries.

What is a Microlibrary?

A microlibrary is different from past libraries because they are:

  1. Smaller libraries that encompass less
  2. Larger libraries have been broken up and multiple microlibraries are now replacing a prior large library.

What you are seeing is S.O.L.I.D. principles applied to libraries. Many libraries broke the S in solid by having multiple responsibilities. However, the owners of many open source libraries have noticed this and have split their libraries into responsibilities.

Examples of Microlibraries

There are plenty of examples in Javascript and other languages, but the idea of microlibries can be best described by looking at dotnet core. Microsoft has adopted the idea of microlibraries, though I doubt they use the term yet. No longer does dotnet include everything, as it did with .Net Framework. Instead, the many pieces of dotnet are now microlibries that can be consumed from NuGet.

  • See https://github.com/dotnet and you will find well over two hundred separate repositories. Never before has dotnet been so decoupled. This is a glowing example of microlibraries.

For a personal example, I have created the Rhyous libraries that you can find on NuGet. I don’t have one giant Rhyous NuGet package. I have many Microlibaries.

  • Rhyous.Collections
  • Rhyous.EasyCsv
  • Rhyous.EasyXml
  • Rhyous.StringLibrary
  • Rhyous.SimpleArgs
  • Rhyous.SimplePluginLoader
  • Rhyous.SimplePluginLoader.Autofac (notice that this is an add-on to Rhyous.SimplePluginLoader, but is still separate as Autofac integration is a separate concern.)
  • etc . . .

We’ve always had libraries, what changed?

The move to microlibraries has been occurring for well over a decade. It just appears that nobody has put a name to it. The greatest enabler of microlibraries has been:

  1. The tooling around package management.
  2. The tooling around continuous delivery. Automated check-in, code-reviews, build, test, deploy, publish.

Package Management

C# has NuGet, javascript has npm, Java has maven. The ability to easily create, publish, find, and consume a package has made microlibraries possible.

Continuous Delivery

Microlibraries need to be published to package management systems. As the tooling has improved, the ability to automate this has simplified. Microsoft has Azure DevOps, GitHub (also now Microsoft) has it’s actions, and Appveyor also makes it easy. Not to mention many of the these tools provide the tooling free to open source projects.

Continuous Delivery as Code has become the norm. Even the most simple of open source projects (most of mine) can have an automated process for check-in, code review, build, test, and publishing a package with very minimal work. And that work is checked in to a build file (AppVeyor and Azure DevOps both use yaml) which can easily be copied and pasted to other small projects with only the strings (names and paths) of the build file changing.

The benefits of Microlibraries

The smaller the libraries, the easier they are to work with. Also, the easier they are to be complete and rarely touched. Smaller means every part becomes easier. Many smaller pieces means we more easily see the commonalities. This ability to see commonalities is what lead to the package management systems which lead to further shrinking libraries as management their inclusion in new projects became easier.

Code

Less code is easier to maintain. It is easier to refactor and change. Since the project is far smaller, the idea of refactoring to be solid and testable code is less daunting and soon the code is refactored, more testable. An example of this is with AutoMapper. They used to have everything as untestable static classes, but recently in a major release, they replaced their statics and now support dependency injection, making the library more solid and testable.

Adding new features becomes much easier with small projects.

Build

Build is smaller and easier. The entire build and test process is very small, allowing for feedback within minutes on code changes (i.e. pull requests).

A one-step build (one of the top items of the Joel test) is so much easier with a microlibrary.

Build decoupling. Have you ever heard of those builds that take an hour. Some are worse, and take four hours or even a day. Microlibraries solved this. Any given build pulls a lot of already built code, and builds only the minimal code needed. Your final application may not be a microlibary, but it may encompass many microlibraries. Your build should take minutes because instead of building everything every time, it uses already built microlibraries and only builds the code for you final application. If you still have four hour builds, you might want to take a look at how you can split your build into microlibraries.

Tests

Tests are less and easier. The more tests, the less bugs. The more likely a new change doesn’t cause regression.

Again, your final application doesn’t need to run all the tests for each microlibrary. The microlibrary’s own build and test process does that. That means you can focus your tests on your application, which is faster.

Learning / Onboarding

It is far easier to learn a small amount of code. It is easier to understand even without good comments and excellent test coverage. If those are missing, adding comments and unit test code coverage is not as overwhelming.

New developers can usually pick up a microlibrary and get the code, get it building, and tests running within an hour. Onboarded developers can be productive in the first week.

Conclusion

Microlibraries are not just the future, the are already the present. The benefits are so great, that any other method of releasing code seems antiquated.



Hello Paypal Here. Goodbye Square Up.

PayPal-HereI love my new Surface Pro 3. When I go to a conference, I want my Surface Pro 3 to be used as the Cash Registers. Alas, Square Up doesn’t support the Surface Pro 3. But guess what? Paypal Here, a direct competitor to Square Up does support the Surface Pro 3. My Paypal Here card reader is on its way.

I accepted, begrudgingly, the fact that you didn’t work with my Windows 7 laptop when I first got Square Up. But that was more than two years ago. There are 300 million windows devices out there. Why would you ignore that market share?

Thank you Squareup.com for being a good card reader. I enjoyed your server. I liked it. However, you haven’t kept up with the industry. The Surface Pro 3, as well as other similar 3rd party hybrid tablet/laptops, is turning iPads and Android tablets into paperweights. You’ll be fine without me. Hopefully you update your software soon before you lose more accounts than mine. Once I am up and working with PayPal Here, I doubt I will make the effort to come back.

So I tell you goodbye Square. And hello PayPal Here!

Get PayPal Here from the Windows Store.

Note: This isn’t an ad. I wasn’t paid to make this post. I am however, frustrated with Square Up for not providing an App for my Surface Pro 3.

Splitting sentences in C# using Stanford.NLP

So I need to break some sentences up. I have a pretty cool regex that does this, however, I want to try out Stanford.NLP for this. Let’s check it out.

  1. Create a Visual Studio C# project.
    I chose a New Console Project and named it SentenceSplitter.
  2. Right-click on the project and choose “Manage NuGet Packages.
  3. Add the Stanford.NLP.CoreNLP nuget package.
  4. Add the following code to Program.cs (This is a variation of the code provide here: http://sergey-tihon.github.io/Stanford.NLP.NET/StanfordCoreNLP.html
    using edu.stanford.nlp.ling;
    using edu.stanford.nlp.pipeline;
    using java.util;
    using System;
    using System.IO;
    using Console = System.Console;
    
    namespace SentenceSplitter
    {
        class Program
        {
            static void Main(string[] args)
            {
                // Path to the folder with models extracted from `stanford-corenlp-3.4-models.jar`
                var jarRoot = @"stanford-corenlp-3.4-models\";
    
                const string text = "I went or a run. Then I went to work. I had a good lunch meeting with a friend name John Jr. The commute home was pretty good.";
    
                // Annotation pipeline configuration
                var props = new Properties();
                props.setProperty("annotators", "tokenize, ssplit, pos, lemma, ner, parse, dcoref");
                props.setProperty("sutime.binders", "0");
    
                // We should change current directory, so StanfordCoreNLP could find all the model files automatically 
                var curDir = Environment.CurrentDirectory;
                Directory.SetCurrentDirectory(jarRoot);
                var pipeline = new StanfordCoreNLP(props);
                Directory.SetCurrentDirectory(curDir);
    
                // Annotation
                var annotation = new Annotation(text);
                pipeline.annotate(annotation);
    
                // these are all the sentences in this document
                // a CoreMap is essentially a Map that uses class objects as keys and has values with custom types
                var sentences = annotation.get(typeof(CoreAnnotations.SentencesAnnotation));
                if (sentences == null)
                {
                    return;
                }
                foreach (Annotation sentence in sentences as ArrayList)
                {
                    Console.WriteLine(sentence);
                }
            }
        }
    }
    

    Warning! If you try to run here, you will get the following exception: Unrecoverable error while loading a tagger model

    java.lang.RuntimeException was unhandled
      HResult=-2146233088
      Message=edu.stanford.nlp.io.RuntimeIOException: Unrecoverable error while loading a tagger model
      Source=stanford-corenlp-3.4
      StackTrace:
           at edu.stanford.nlp.pipeline.StanfordCoreNLP.4.create()
           at edu.stanford.nlp.pipeline.AnnotatorPool.get(String name)
           at edu.stanford.nlp.pipeline.StanfordCoreNLP.construct(Properties A_1, Boolean A_2)
           at edu.stanford.nlp.pipeline.StanfordCoreNLP..ctor(Properties props, Boolean enforceRequirements)
           at edu.stanford.nlp.pipeline.StanfordCoreNLP..ctor(Properties props)
           at SentenceSplitter.Program.Main(String[] args) in c:\Users\jbarneck\Documents\Projects\NLP\SentenceSplitter\SentenceSplitter\Program.cs:line 20
           at System.AppDomain._nExecuteAssembly(RuntimeAssembly assembly, String[] args)
           at System.AppDomain.ExecuteAssembly(String assemblyFile, Evidence assemblySecurity, String[] args)
           at Microsoft.VisualStudio.HostingProcess.HostProc.RunUsersAssembly()
           at System.Threading.ThreadHelper.ThreadStart_Context(Object state)
           at System.Threading.ExecutionContext.RunInternal(ExecutionContext executionContext, ContextCallback callback, Object state, Boolean preserveSyncCtx)
           at System.Threading.ExecutionContext.Run(ExecutionContext executionContext, ContextCallback callback, Object state, Boolean preserveSyncCtx)
           at System.Threading.ExecutionContext.Run(ExecutionContext executionContext, ContextCallback callback, Object state)
           at System.Threading.ThreadHelper.ThreadStart()
      InnerException: edu.stanford.nlp.io.RuntimeIOException
           HResult=-2146233088
           Message=Unrecoverable error while loading a tagger model
           Source=stanford-corenlp-3.4
           StackTrace:
                at edu.stanford.nlp.tagger.maxent.MaxentTagger.readModelAndInit(Properties config, String modelFileOrUrl, Boolean printLoading)
                at edu.stanford.nlp.tagger.maxent.MaxentTagger..ctor(String modelFile, Properties config, Boolean printLoading)
                at edu.stanford.nlp.tagger.maxent.MaxentTagger..ctor(String modelFile)
                at edu.stanford.nlp.pipeline.POSTaggerAnnotator.loadModel(String A_0, Boolean A_1)
                at edu.stanford.nlp.pipeline.POSTaggerAnnotator..ctor(String annotatorName, Properties props)
                at edu.stanford.nlp.pipeline.StanfordCoreNLP.4.create()
           InnerException: java.io.IOException
                HResult=-2146233088
                Message=Unable to resolve "edu/stanford/nlp/models/pos-tagger/english-left3words/english-left3words-distsim.tagger" as either class path, filename or URL
                Source=stanford-corenlp-3.4
                StackTrace:
                     at edu.stanford.nlp.io.IOUtils.getInputStreamFromURLOrClasspathOrFileSystem(String textFileOrUrl)
                     at edu.stanford.nlp.tagger.maxent.MaxentTagger.readModelAndInit(Properties config, String modelFileOrUrl, Boolean printLoading)
                InnerException: 
    
    
  5. Download the stanford-corenlp-full-3.4.x.zip file from here: http://nlp.stanford.edu/software/corenlp.shtml#Download
  6. Extract the stanford-corenlp-full-2014-6-16.x.zip.
    Note: Over time, as new versions come out, make sure the version you download matches the version of your NuGet package.
  7. Extract the stanford-corenlp-3.4-models.jar file to stanford-corenlp-3.4-models.
    I used 7zip to extract the jar file.
  8. Copy the stanford-corenlp-3.4-models folder to your Visual Studio project files.
    Note: This is one way to include the jar file in your project. Other ways might be a copy action or another good way would be to use an app.config appSetting. I chose this way because it makes all my files part of the project for this demo. I would probably use the app.config method in production.
  9. In Visual Studio, use ctrl + left click to  highlight the stanford-corenlp-3.4-models folder and all subfolders.
  10. Open Properties (Press F4), and change the namespace provider setting to false.
  11. In Visual Studio, use ctrl + left click to  highlight the files under the stanford-corenlp-3.4-models folder and all files in all subfolders.
  12. Open Properties (Press F4), and change the Build Action to Content and the Copy to Output Directory setting to Copy if newer.
  13. Run the code.


Note: At first I tried to just load the model file. That doesn’t work. I got an exception. I had to set the @jarpath as shown above. I needed to copy all the contents of the jar file.

Results

Notice that I through it curve ball by ending a sentence with Jr. It still figured it out.

I went or a run. Then I went to work. I had a good lunch meeting with a friend name John Jr. The commute home was pretty good.

However, I just tried this paragraph and it did NOT detect the break after the first sentence.

Exit Room A. Turn right. Go down the hall to the first door. Enter Room B.

I am pretty sure this second failure is due to the similarity in string with a legitimate first name, middle initial, last name.

Jared A. Barneck
Room A. Turn

Now the question is, how do I train it to not make such mistakes?

Support Tools for LDMS 9.5 Released

Support Tools for LDMS 9.5 Released

Go here for more information:

LANDesk Support Tools

Removing all xml or html tags using Notepad++

Let’s say you have an xml or an html document and you want to remove the tags.

<h2>Shopping List</h2>
<ol>
	<li>Milk</li>
	<li>eggs</li>
	<li>butter</li>
	<li>cereal</li>
	<li>bananas</li>
	<li>apples</li>
	<li>orange juice</li>
	<li>yogurt</li>
	<li>bread</li>
	<li>cheese</li>
</ol>

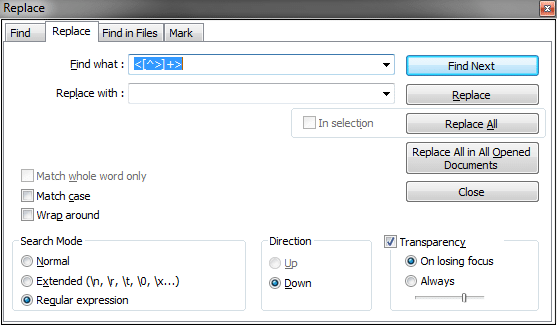
This can be done rather quickly in a tool like notepad++ using the find and replace with regular expressions feature.

  1. Go to Find and Replace.
  2. Enter this regular expression: <[^>]+>
  3. Select regular expression.
  4. Make sure the cursor is at the start of the document.
  5. Click replace all.

That is it.

How to open a command prompt on a remote computer

There are three tools that can do this:

  • PSExec – Not redistributable but free for download. No source code.
  • RemCom – BSD Licensed but not really maintained and I haven’t been able to get it to work in Windows 7. Source code available. Uses its own command line.
  • PAExec – Free to distribute but no source code. Uses same command line as PSExec.

So they all use the same command line to connect to a remote computer. I think I am going to go with PAExec because it is newer, maintained, distributable, and works in Windows 7.

PAExec \\RemotePC cmd.exe

However, with that command line, it can be confusing to have a command prompt open on your machine without a way to know it is actually a command prompt for a remote computer so it is a good idea to add a prompt.

PAExec \\RemotePC cmd.exe /k prompt $C%computername%$F$S$p$G

I hope this helps.

Creating a drill down chart with ASP.NET and MSChart

In my first post, A basic reporting chart in ASP.NET, I went over the basics of creating a report using MSChart and ASP.NET and this was quit easy. However, in today’s world where the importance of business intelligence is ever increasing, the ability to drill down on a report has become the de facto standard. MSChart, ASP.NET, and HTML make it easy to create a drill-down report.

Note: Microsoft has a drill-down report in their ChartSamples example, but it was bundled as part of the same project with two-hundred other reports and was not a minimal example. It requires the use of an Access database (and I had nothing to read Access with), it has a bunch of javascript code that is for a tooltip preview of the drill down report, and the charts are in two objects. All of this made it more difficult for me to break this down.  In this example, the report will be its own ASP.NET project and will be a minimal example, however the use case and the sample data is taken directly from Microsoft’s example.

Report Example Use Case

Imagine you have a list of sales reps, their regions, and their sales results. You want a report to look at total sales per region. Then you want to click on a region to the see the sales by sales rep.

Download the project here: SampleChart.zip

Step 1 – Create the Visual Studio project

  1. In Visual Studio, click on File | New | Project.
  2. Select Visual C# | Web from the Installed Templates.
  3. Locate and select ASP.NET Empty Web Application.
    Note: I like to demonstrate using an Empty project you nothing is done for you, and you have to learn everything you actually need to do.
  4. Give the project a name.
    I named mine DrillDownChart because that is my example’s purpose.
  5. Click OK.
  6. Right-click on the newly created project and click Add | Reference.
  7. Select the .NET tab.
  8. Locate System.Web.DataVisualization and highlight it.
  9. Click OK.

Step 2 – Add a web form for your chart

  1. Right-click on the Project and choose Add |  New Item.
  2. Select Web Form.
  3. Give the file a name.
    I named my file  Report.aspx.
  4. Click OK.

Step 3 – Create a data object for the report

Because data is often coming from a database, this example is going to use a DataSet. I am not going to connect to a database, but just use a statically build DataSet.

  1. Right-click on the Project and choose Add |  Class.
  2. Give the file a name.
    I named my file  SalesDataSet.cs.
  3. Make the class inherit from DataSet.
  4. Click OK.

Step 4 – Add example data to the data object for the report

While in a real world scenario, you would get the data from a database or somewhere, lets first just create some sample data. We are going to create two simple tables. One is a Region table, that has the region name and ID. One is a RepSales table that has sales per rep and the rep’s region id.

  1. Create a property with only a getter that creates a region DataTable called RegionTable.
  2. Add the columns needed: RegionID and RegionName.
  3. Add the appropriate rows.
  4. Create a property with only a getter that creates a reps sales DataTable called RepsSalesTable.
  5. Add the columns needed: ID, Name, RegionID, and Sales.
  6. Add the appropriate rows.
  7. Now in your constructor, add those to the list of Tables in your object.
    using System;
    using System.Collections.Generic;
    using System.Linq;
    using System.Web;
    using System.Data;
    
    namespace DrillDownChart
    {
        public class SalesDataSet : DataSet
        {
            public SalesDataSet()
            {
                Tables.Add(RegionTable);
                Tables.Add(RepsSalesTable);
    
            }
    
            public DataTable RegionTable
            {
                get
                {
                    if (_RegionTable == null)
                    {
                        List<String> Regions = new List<string>() { "East", "West", "Central", "International", "South" };
    
                        _RegionTable = new DataTable("Region");
                        _RegionTable.Columns.Add("RegionID", typeof(int));
                        _RegionTable.Columns.Add("RegionName", typeof(string));
    
                        int i = 0;
                        foreach (var region in Regions)
                        {
                            DataRow row = _RegionTable.NewRow();
                            row["RegionID"] = ++i;
                            row["RegionName"] = region;
                            _RegionTable.Rows.Add(row);
                        }
    
                    }
                    return _RegionTable;
                }
            } private DataTable _RegionTable;
    
            public DataTable RepsSalesTable
            {
                get
                {
                    if (_RepsSalesTable == null)
                    {
                        List<String> reps = new List<string>() {
                            "Aaron", "Larry", "Andrew", "Mary", "Sally", "Nguyen", "Francis",
                            "Jerry", "Danny", "Jim", "Sarah", "Hannah", "Kim", "Gerry", "Bob" };
                        int[] regions = { 1, 2, 3, 1, 4, 2, 4, 3, 1, 2, 2, 3, 5, 5, 5 };
                        int[] sales = { 10440, 17772, 23880, 7663, 21773, 32294, 11983, 14991,
                                        17946, 8551, 19443, 27887, 30332, 16668, 21225 };
    
                        _RepsSalesTable = new DataTable("RepsSales");
                        _RepsSalesTable.Columns.Add("ID", typeof(int));
                        _RepsSalesTable.Columns.Add("Name", typeof(string));
                        _RepsSalesTable.Columns.Add("RegionID", typeof(int));
                        _RepsSalesTable.Columns.Add("Sales", typeof(int));
    
                        for (int i = 0; i < reps.Count; i++)
                        {
                            DataRow row = _RepsSalesTable.NewRow();
                            row["ID"] = i + 1;
                            row["Name"] = reps[i];
                            row["RegionID"] = regions[i];
                            row["Sales"] = sales[i];
    
                            _RepsSalesTable.Rows.Add(row);
                        }
    
                    }
                    return _RepsSalesTable;
                }
            } private DataTable _RepsSalesTable;
        }
    }
    

That is it, your fake example data is prepared.

Step 5 – Add a Chart to the Report.aspx file

  1. Open the Report.aspx file.
  2. Add a Register to the System.Web.DataVisualization assembly.
  3. Locate the div inside the body.
  4. Inside the div, add a Chart that includes a ChartArea.
    <%@ Page Language="C#" AutoEventWireup="true" CodeBehind="Report.aspx.cs" Inherits="CompareYearsByQuarter.Report" %>
    
    <%@ Register Assembly="System.Web.DataVisualization, Version=4.0.0.0, Culture=neutral, PublicKeyToken=31bf3856ad364e35"
        Namespace="System.Web.UI.DataVisualization.Charting" TagPrefix="asp" %>
    
    <!DOCTYPE html PUBLIC "-//W3C//DTD XHTML 1.0 Transitional//EN" "http://www.w3.org/TR/xhtml1/DTD/xhtml1-transitional.dtd">
    <html xmlns="http://www.w3.org/1999/xhtml">
    <head runat="server">
        <title></title>
    </head>
    <body>
        <form id="form1" runat="server">
        <div>
            <asp:Chart ID="SalesReport" runat="server">
                <chartareas>
                    <asp:ChartArea Name="ChartArea1">
                    </asp:ChartArea>
                </chartareas>
            </asp:Chart>
        </div>
        </form>
    </body>
    </html>
    

Step 6 – Add code the Report.aspx.cs file

We are going to use the same object for both the original report and the drill down report. We will just a little code that switches which data the chart is populated with.

  1. Open the Report.aspx.cs file.
  2. Create an instance of the SalesDataSet object that has our sample data.
  3. Add code in the Page_Load method to configure the Chart.
    Note 1: The steps for this code is in the code and comments itself. I created a method for each step and then populated the methods as  needed.
    Note 2: Notice that the AddDataToSeries() method uses and if statement to determine whether to add the original data or the drill down data.
    Note 3: Because we used a DataTable we query the example data using LINQ. It is likely that in your production reports you are using a real database and you will probably use queries directly to your database.

    using System;
    using System.Collections.Generic;
    using System.Linq;
    using System.Web;
    using System.Web.UI;
    using System.Web.UI.WebControls;
    using System.Data;
    using System.Web.UI.DataVisualization.Charting;
    
    namespace DrillDownChart
    {
        public partial class RegionReport : System.Web.UI.Page
        {
            // Step 1 - Create Example Data
            SalesDataSet ExampleData = new SalesDataSet();
    
            protected void Page_Load(object sender, EventArgs e)
            {
                // Step 2 - Populate chart drop down
                PopulateChartTypeDropDown();
    
                // Step 3 - Create Series
                Series series = CreateSeries();
    
                // Step 4 - Set the chart type
                SetChartType(series);
    
                // Step 5 - Add data (and if needed drilldown links to series)
                AddDataToSeries(series);
    
                // Step 6 - Add series into the chart's series collection
                SalesReport.Series.Add(series);
            }
    
            private void PopulateChartTypeDropDown()
            {
                List<String> chartTypes = new List<String>(Enum.GetNames(typeof(SeriesChartType)));
                chartTypes.Insert(0, "");
    
                foreach (var item in chartTypes)
                {
                    DropDownListChartType.Items.Add(item);
                }
            }
    
            private Series CreateSeries()
            {
                Series series = new Series("Sales");
                series.BorderWidth = 3;
                series.ShadowOffset = 2;
                return series;
            }
    
            private void SetChartType(Series inSeries)
            {
                if (Page.Request["ChartType"] != null)
                    DropDownListChartType.SelectedValue = Page.Request["ChartType"];
    
                if (DropDownListChartType.SelectedValue.ToString() == "")
                    DropDownListChartType.SelectedValue = SeriesChartType.Column.ToString();
    
                inSeries.ChartType = (SeriesChartType)System.Enum.Parse(typeof(SeriesChartType), DropDownListChartType.SelectedValue.ToString());
            }
    
            private void AddDataToSeries(Series series)
            {
                if (Page.Request["ChartType"] == null)
                    AddAllRegionData(series);
                else
                    AddSpecificRegionData(series);
            }
    
            private void AddAllRegionData(Series series)
            {
                DataTable sales = ExampleData.Tables["RepsSales"];
                DataTable regions = ExampleData.Tables["Region"];
    
                var query = from reps in sales.AsEnumerable()
                            join region in regions.AsEnumerable()
                            on reps.Field<int>("RegionID") equals region.Field<int>("RegionID")
                            group reps by region.Field<string>("RegionName") into regionGroup
                            select new { Region = regionGroup.Key, Sales = regionGroup.Sum(total => total.Field<int>("Sales")) };
    
                // Populate new series with data
                foreach (var value in query)
                {
                    series.Points.AddXY(value.Region, value.Sales);
                }
    
                // Step 7 - Make this series drillable
                for (int i = 0; i < series.Points.Count; i++)
                {
                    series.Points[i].Url = string.Format("RegionReport.aspx?region={0}&ChartType={1}", series.Points[i].AxisLabel, DropDownListChartType.SelectedValue);
                }
            }
    
            private void AddSpecificRegionData(Series series)
            {
                var query = from reps in ExampleData.RepsSalesTable.AsEnumerable()
                            join region in ExampleData.RegionTable.AsEnumerable()
                            on reps.Field<int>("RegionID") equals region.Field<int>("RegionID")
                            where region.Field<string>("RegionName") == (Page.Request["Region"] ?? "East")
                            select new { RepName = reps.Field<string>("Name"), Sales = reps.Field<int>("Sales") };
    
                // Populate new series with data
                foreach (var value in query)
                {
                    series.Points.AddXY(value.RepName, value.Sales);
                }
    
                // Step 7 - Make this series drillable
                for (int i = 0; i < series.Points.Count; i++)
                //{
                //    // Add drill down code to drill to a third chart
                //}
            }
    
            private void AddDrillDown(Series series)
            {
                for (int i = 0; i < series.Points.Count; i++)
                {
                    series.Points[i].Url = string.Format("RegionReport.aspx?region={0}&ChartType={1}", series.Points[i].AxisLabel, DropDownListChartType.SelectedValue);
                }
            }
        }
    }
    

Step 7 – Add an http handler to the Web.Config for the Chart

  1. Open the Web.Config file.
  2. Add an http handler for the chart.
<?xml version="1.0"?>
<configuration>
  <system.web>
    <compilation debug="true" targetFramework="4.0" />
    <httpHandlers>
      <add path="ChartImg.axd" verb="GET,HEAD,POST" validate="false"
           type="System.Web.UI.DataVisualization.Charting.ChartHttpHandler, System.Web.DataVisualization, Version=4.0.0.0, Culture=neutral, PublicKeyToken=31bf3856ad364e35" />
    </httpHandlers>
  </system.web>
</configuration>

Your project is now complete.

You now have a report that shows you the total sales per region.

Click on the report and you have the sales per region broken out by sales rep.

And your done.

Download the project here: SampleChart.zip

A basic reporting chart in ASP.NET

It is time to learn to write some charts. By charts I mean graphic views for reporting on data.

Obtaining MSChart

For .NET 4, MSChart is included in the .NET Framework, so if you have installed .NET 4, you have already obtained MSChart.

For .NET 3.5, the MSChart project which was an add-on. If you are using .NET 3.5, you need to download and install the add-on.

Note: I am using .NET 4 and it was installed with Visual Studio 2010, so I have no need to install the add-on.

Also, we are going to the very minimal steps manually. Many of these steps may be done for you (for example, the Visual Studio Designer will populate the Web.Config for you, but it is always good to know how do things yourself.

Report Example Use Case

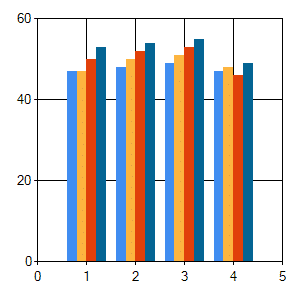
Imagine you have sales trending for four years, 2009-2012, and you want to visualize this trend. You want a chart that should all four years, with the quarter results next to each other.

Download the project here: SampleChart.zip

Step 1 – Create the Visual Studio project

  1. In Visual Studio, click on File | New | Project.
  2. Select Visual C# | Web from the Installed Templates.
  3. Locate and select ASP.NET Empty Web Application.
    Note: I like to demonstrate using an Empty project you nothing is done for you, and you have to learn everything you actually need to do.
  4. Give the project a name.
  5. Click OK.
  6. Right-click on the newly created project and click Add | Reference.
  7. Select the .NET tab.
  8. Locate System.Web.DataVisualization and highlight it.
  9. Click OK.

Step 2 – Add a web form for your chart

  1. Right-click on the Project and choose Add |  New Item.
  2. Select Web Form.
  3. Give the file a name.
    I named my file  Report.aspx.
  4. Click OK.

Step 3 – Create a data object for the report

  1. Right-click on the Project and choose Add |  Class.
  2. Give the file a name.
    I named my file  Data.cs.
  3. Click OK.

Step 4 – Add example data to the data object for the report

While in a real world scenario, you would get the data from a database or somewhere, lets first just create some sample data.

  1. Create a few lists of numbers, one for each year as shown.
    namespace CompareYearsByQuarter
    {
        public class Data
        {
            public int[] Sales2009 = new int[] { 47, 48, 49, 47 };
            public int[] Sales2010 = new int[] { 47, 50, 51, 48 };
            public int[] Sales2011 = new int[] { 50, 52, 53, 46 };
            public int[] Sales2012 = new int[] { 53, 54, 55, 49 };
        }
    }
    

That is it, your fake example data is prepared.

Step 5 – Add a Chart to the Report.aspx file

  1. Open the Report.aspx file.
  2. Add a Register to the System.Web.DataVisualization assembly.
  3. Locate the div inside the body.
  4. Inside the div, add a Chart that includes a ChartArea.
    <%@ Page Language="C#" AutoEventWireup="true" CodeBehind="Report.aspx.cs" Inherits="CompareYearsByQuarter.Report" %>
    
    <%@ Register Assembly="System.Web.DataVisualization, Version=4.0.0.0, Culture=neutral, PublicKeyToken=31bf3856ad364e35"
        Namespace="System.Web.UI.DataVisualization.Charting" TagPrefix="asp" %>
    
    <!DOCTYPE html PUBLIC "-//W3C//DTD XHTML 1.0 Transitional//EN" "http://www.w3.org/TR/xhtml1/DTD/xhtml1-transitional.dtd">
    <html xmlns="http://www.w3.org/1999/xhtml">
    <head runat="server">
        <title></title>
    </head>
    <body>
        <form id="form1" runat="server">
        <div>
            <asp:Chart ID="SalesReport" runat="server">
                <chartareas>
                    <asp:ChartArea Name="ChartArea1">
                    </asp:ChartArea>
                </chartareas>
            </asp:Chart>
        </div>
        </form>
    </body>
    </html>
    

Step 6 – Add code the Report.aspx.cs file

  1. Open the Report.aspx.cs file.
  2. Create an instance of the Data object that has our sample data.
  3. Add code in the Page_Load method to configure the Chart a separate series of data for each year.
    using System;
    using System.Collections.Generic;
    using System.Linq;
    using System.Web;
    using System.Web.UI;
    using System.Web.UI.WebControls;
    using System.Web.UI.DataVisualization.Charting;
    
    namespace CompareYearsByQuarter
    {
        public partial class Report : System.Web.UI.Page
        {
            Data data = new Data();
    
            protected void Page_Load(object sender, EventArgs e)
            {
                Series year2009 = new Series("Sales 2009");
                // Populate new series with data
                foreach (var value in data.Sales2009)
                {
                    year2009.Points.AddY(value);
                }
                SalesReport.Series.Add(year2009);
    
                Series year2010 = new Series("Sales 2010");
                // Populate new series with data
                foreach (var value in data.Sales2010)
                {
                    year2010.Points.AddY(value);
                }
                SalesReport.Series.Add(year2010);
    
                Series year2011 = new Series("Sales 2011");
                // Populate new series with data
                foreach (var value in data.Sales2011)
                {
                    year2011.Points.AddY(value);
                }
                SalesReport.Series.Add(year2011);
    
                Series year2012 = new Series("Sales 2012");
                // Populate new series with data
                foreach (var value in data.Sales2012)
                {
                    year2012.Points.AddY(value);
                }
                SalesReport.Series.Add(year2012);
            }
        }
    }
    

Step 7 – Add an http handler to the Web.Config for the Chart

  1. Open the Web.Config file.
  2. Add an http handler for the chart.
<?xml version="1.0"?>
<configuration>
  <system.web>
    <compilation debug="true" targetFramework="4.0" />
    <httpHandlers>
      <add path="ChartImg.axd" verb="GET,HEAD,POST" validate="false"
           type="System.Web.UI.DataVisualization.Charting.ChartHttpHandler, System.Web.DataVisualization, Version=4.0.0.0, Culture=neutral, PublicKeyToken=31bf3856ad364e35" />
    </httpHandlers>
  </system.web>
</configuration>

You are done. Build and look at your report.

You now have a simple report that should show you the sales trend for quarters 1,2,3,4 over four years. Your chart should look like this.

Download the project here: SampleChart.zip

A non-compete and single ownership version of the BSD License

I recently created an API and I wanted to give it a license where it is free for anyone to use, so I was planning on using the two-clause BSD License. However, after further thought, I realized that I had a few more stipulations I wanted to add. Yes, I wanted the software to be free to use, however, there are a few things I don’t want.

  1. I don’t really want someone to fork my project just yet. I want the project to remain in one place.
  2. I want the project to be free and commercial friendly, including free to use the code, or link to a binary in any way.
  3. I don’t want a company to use my software to sell a competing solution unless I am compensated. In which case, I can license the software to them under a commercial license.
  4. If anyone contributes to the project, I would like the right to sell the code under a different (possibly commercial) license. This prevents license and author sprawl. The fourth clause is crossed out because this will be done at commit time and is not needed in the license of existing source code.

Non-compete line addition to the new BSD License

So I came up with two one more line to the new BSD License: a third line prohibiting competing projects or solutions without permission; a fourth line that states that any contributions to the project will result in the all rights to the contributed code being assigned back to me. This will be done at commit time and is not needed in the license of existing source code.

<Project> <Project Description>
Copyright (c) <Year>, <Owner>
All rights reserved.

Redistribution and use in source and binary forms, with or without
modification, are permitted provided that the following conditions are met:

1. Redistributions of source code must retain the above copyright notice, this
   list of conditions and the following disclaimer.
2. Redistributions in binary form must reproduce the above copyright notice,
   this list of conditions and the following disclaimer in the documentation
   and/or other materials provided with the distribution.
3. Use of the source code or binaries that in any way competes with <Project>,
   whether open source or commercial or other, is prohibited unless permission
   is granted under a separate license by <Owner>.

THIS SOFTWARE IS PROVIDED BY THE COPYRIGHT HOLDERS AND CONTRIBUTORS "AS IS" AND
ANY EXPRESS OR IMPLIED WARRANTIES, INCLUDING, BUT NOT LIMITED TO, THE IMPLIED
WARRANTIES OF MERCHANTABILITY AND FITNESS FOR A PARTICULAR PURPOSE ARE
DISCLAIMED. IN NO EVENT SHALL THE COPYRIGHT OWNER OR CONTRIBUTORS BE LIABLE FOR
ANY DIRECT, INDIRECT, INCIDENTAL, SPECIAL, EXEMPLARY, OR CONSEQUENTIAL DAMAGES
(INCLUDING, BUT NOT LIMITED TO, PROCUREMENT OF SUBSTITUTE GOODS OR SERVICES;
LOSS OF USE, DATA, OR PROFITS; OR BUSINESS INTERRUPTION) HOWEVER CAUSED AND
ON ANY THEORY OF LIABILITY, WHETHER IN CONTRACT, STRICT LIABILITY, OR TORT
(INCLUDING NEGLIGENCE OR OTHERWISE) ARISING IN ANY WAY OUT OF THE USE OF THIS
SOFTWARE, EVEN IF ADVISED OF THE POSSIBILITY OF SUCH DAMAGE.

Let me know if you think this accomplish the non-compete goal. Especially let me know if something appears erroneous.

Single Ownership

Single ownership means the project always has all rights to every line of code, the binaries, and documentation or anything else that may be included in the project. So if any contributions from anybody to the project occur, they occur with the stipulation that ownership and all rights are transferred to the the project owners.

However, doing this in the license above is the wrong place. It should be a separate agreement that occurs in places like when registering with the project or its mailing list or it source repository. So contribution is done under this separate agreement.

Contributing to this project can be done under the following conditions:
  1. Any contribution (source code, documentation, or other) to this project 
     is your own work.
  2. You transfer all rights to the contribution (source code, documentation,
     or other) to <Owner>.

Again, let me know if this accomplishes the goal, or is insufficient or has errors.

Fork and Contribute License

I have worked on this and updated the above as follows:

<Project> - <Project description or tagline>

Copyright (c) 2012, <owner>
All rights reserved.
 
Redistribution and use in source and binary forms, with or without
modification, are permitted provided that the following conditions are met:
 
1. Redistributions of source code must retain the above copyright notice, this
   list of conditions and the following disclaimer.
2. Redistributions in binary form must reproduce the above copyright notice,
   this list of conditions and the following disclaimer in the documentation
   and/or other materials provided with the distribution.
3. Use of the source code or binaries that in any way competes with <project>
   or competes with distribution, whether open source or commercial, is 
   prohibited unless permission is specifically granted under a separate
   license by <owner>.
4. Forking for personal or internal, or non-competing commercial use is allowed.
   Distributing compiled releases as part of your non-competing project is 
   allowed.
5. Public copies, or forks, of source is allowed, but from such, public
   distribution of compiled releases is forbidden.
6. Source code enhancements or additions are the property of the author until
   the source code is contributed to this project. By contributing the source
   code to this project, the author immediately grants all rights to the
   contributed source code to <owner>.
 
THIS SOFTWARE IS PROVIDED BY THE COPYRIGHT HOLDERS AND CONTRIBUTORS "AS IS" AND
ANY EXPRESS OR IMPLIED WARRANTIES, INCLUDING, BUT NOT LIMITED TO, THE IMPLIED
WARRANTIES OF MERCHANTABILITY AND FITNESS FOR A PARTICULAR PURPOSE ARE
DISCLAIMED. IN NO EVENT SHALL THE COPYRIGHT OWNER OR CONTRIBUTORS BE LIABLE FOR
ANY DIRECT, INDIRECT, INCIDENTAL, SPECIAL, EXEMPLARY, OR CONSEQUENTIAL DAMAGES
(INCLUDING, BUT NOT LIMITED TO, PROCUREMENT OF SUBSTITUTE GOODS OR SERVICES;
LOSS OF USE, DATA, OR PROFITS; OR BUSINESS INTERRUPTION) HOWEVER CAUSED AND
ON ANY THEORY OF LIABILITY, WHETHER IN CONTRACT, STRICT LIABILITY, OR TORT
(INCLUDING NEGLIGENCE OR OTHERWISE) ARISING IN ANY WAY OUT OF THE USE OF THIS
SOFTWARE, EVEN IF ADVISED OF THE POSSIBILITY OF SUCH DAMAGE.

The two-clause BSD License

Here is the two-clause BSD License, sometimes called the FreeBSD License or the Simplified BSD License.

Copyright (c) <Year>, <Owner>
All rights reserved.

Redistribution and use in source and binary forms, with or without
modification, are permitted provided that the following conditions are met:

1. Redistributions of source code must retain the above copyright notice, this
   list of conditions and the following disclaimer.
2. Redistributions in binary form must reproduce the above copyright notice,
   this list of conditions and the following disclaimer in the documentation
   and/or other materials provided with the distribution.

THIS SOFTWARE IS PROVIDED BY THE COPYRIGHT HOLDERS AND CONTRIBUTORS "AS IS" AND
ANY EXPRESS OR IMPLIED WARRANTIES, INCLUDING, BUT NOT LIMITED TO, THE IMPLIED
WARRANTIES OF MERCHANTABILITY AND FITNESS FOR A PARTICULAR PURPOSE ARE
DISCLAIMED. IN NO EVENT SHALL THE COPYRIGHT OWNER OR CONTRIBUTORS BE LIABLE FOR
ANY DIRECT, INDIRECT, INCIDENTAL, SPECIAL, EXEMPLARY, OR CONSEQUENTIAL DAMAGES
(INCLUDING, BUT NOT LIMITED TO, PROCUREMENT OF SUBSTITUTE GOODS OR SERVICES;
LOSS OF USE, DATA, OR PROFITS; OR BUSINESS INTERRUPTION) HOWEVER CAUSED AND
ON ANY THEORY OF LIABILITY, WHETHER IN CONTRACT, STRICT LIABILITY, OR TORT
(INCLUDING NEGLIGENCE OR OTHERWISE) ARISING IN ANY WAY OUT OF THE USE OF THIS
SOFTWARE, EVEN IF ADVISED OF THE POSSIBILITY OF SUCH DAMAGE.

Camtasia Studio 8 is here!

Camtasia Studio

Camtasia Studio 8 is here!  You can find it at http://www.techsmith.com/camtasia.html. Of course you can See What’s New with Camtasia Studio in video.

Camtasia Studio is the most amazing tool for creating computer training videos, web videos, or Vlogging.

The winner of the Camtasia Studio – Free license give-away has been determined and posted in the comments of that article.

Why I Like Camtasia Studo

I really like Camtasia Studio because I have used it and it just works and does what it says it can do in an easy to use fashion. I used it for every training video I created at my last job. I also have used it to submit my homework and video documentation on my final projects to my professors as I get a Masters of Computer Science.

Please feel free to post how you have used it.

P.S. Camtasia didn’t approach me for this give-away, I approached them because of how their software has helped me and how impressed with it I am.

Camtasia Studio – Free license give-away

Camtasia Studio

I have used Camtasia Studio by TechSmith on a number of occasions and I thoroughly enjoy their desktop recording software. Since I like Camtasia Studio so much, I thought I would write a couple of articles on using their software. Since I wanted to write a quick article about them, I contacted them and asked if they would let me host a give away for a free copy of Camtasia Studio right here on my blog. I was totally happy when they said yes.

For details on entering the give-away, see The Give-Away below.

So my blog is not so much about promoting a product as providing instructions for how to do something, so of course, this is going to be a “how to” article. So here is how easy it is to record a video.

Sometimes you want to record something on your desktop. For a blogger like myself, I want to record how something hard is done on a computer. I have int the past used VMWare’s recording feature but it doesn’t record sound. I want both sound and video.

Even though I am geek and a developer and I don’t mind compiling some open source tool from scratch, I am also a fan of quality technology that just works. For recording my desktop or any application with video and sound, Camtasia Studio studio just works. While it is not open source, Camtasia Studio is well worth the license fee for me.

About Camtasia Studio

Let’s talk about Camtasia Studio. Camtasia Studio has a single installer, but like many products it is more of a suite or “studio” of feature.

There are five features installed:

  • Camtasia Studio
  • Camtasia MenuMaker
  • Camtasia Player
  • Camtasia Recorder
  • Camtasia Theater

I have mostly used the Recorder and Camtasia Studio.

Easy posting to YouTube or ScreenCast

Camtasia Studio makes uploading a video to YouTube or ScreenCast easy. All you need is your username and password and Camtasia Studio does the work for you.

It automatically opens your browser and takes you to the link to your online video.

The Give-Away

So Camtasia Studio is giving away a free License.

  • Mac or Windows? They have a version for Windows and Mac and so the winner can choose which license they want.
  • Version: Yes, we will be giving away the new version of Camtasia Studio.
  • Start date: Friday, June 1, 2012.
  • End date: Monday, July 2, 2012.

Here is how you can enter to win it.

Step 1

Like Camtasia Studio on Facebook. Just click the image as it is a link.

 FaceBook

Step 2

Enter your email address. Yes, I will need your email address to contact you if you win!

Your done!

That is it. You are now entered into the give-away.

Utah Open Source Conference 2012

How to compile WinNFSd with Visual Studio?

Recently I needed an NFS server on Windows, preferably written in C++. A long time ago I had used WinNFSd and sure enough the project still exists on Sourceforge, though unfortunately it hasn’t been updated since 2005.

However, I found that someone had updated it here: https://github.com/noodle1983/winnfsd-nd

So the big question, how do you compile this on windows with Visual Studio?

Step 1 – Download and extract the WinNFSd source

  1. Go to https://sourceforge.net/projects/winnfsd and download the source.
    Note: You can alternately download the git hub source as it has an update you might like:
    https://github.com/noodle1983/winnfsd-nd
  2. Click the Zip button at the top of the page to download the source as a zip.
    Note: Alternately if you have git working already you can clone this repo.
  3. Extract the zip file to a directory.  Remember where you extracted it as we will copy the source files later.

Step 2 – Create a new Visual Studio solution

  1. In Visual Studio, go to File | New | Project.
  2. Select Other Languages | Visual C++ | Empty Project.
    Note: Depending on your Visual Studio configuration you may Visual C++ in a different place.
  3. Name the solution WinNFSd.
  4. Click Ok.

Step 3 – Add the WinNFSd files to your solution

  1. In Visual Studio, right-click on your Project and click Open Folder in Windows Explorer.
  2. Create a new folder to hold your source code.
    Note: I simply named my folder src.
  3. Copy the source you extracted in Step 1 into the src directory.
  4. Highlight all the files in the src directory.
  5. Drag the files into Visual Studio and drop them on your project.
Note: If you try to build now, you will get 22 errors in debug mode and maybe 17 in release mode.

Step 4 – Configure the project properties

  1. In Visual Studio, right-click on your project and choose Properties.
    Note: The Configuration should say Active(Debug) currently.
  2. Go to Configuration Properties | Linker | Input.
  3. Add ws2_32.lib to the Additional Dependencies.
  4. Change the Configuration to Release and add ws2_32.lib for release as well.

Step 5 – Handle the Visual Studio C++ Runtime

If you were to compile now, and try to run your project on a different machine (not the one running Visual Studio) you would likely get an error due to a missing dll.  Here is the error you will likely receive.

The program can’t start because MSVCR100.dll is missing from your computer. Try reinstalling the program to fix this problem.

I am not going to explain the solution again here, because it is all documented here:
Avoiding the MSVCR100.dll or MSVCR100D.dll is missing error

Choose the best of the three solutions for you from the link above.

Note: For this single file exe, I prefer the statically linked option.

Step 6 – Build WinNFSd

  1. You should now be able to click Build | Build Solution and it should build.

You should be able to test both debug and release.

Note: I received 37 warnings, which would be nice to resolve, but I wouldn’t worry too much about them.


How to connect to the LANDesk MBSDK using C#?

This article is to demonstrate to LANDesk admins how to connect to the LANDesk MBSDK with C#.

Prerequisites

LANDesk

  1. A LANDesk Core Server accessible via the network.
  2. Credentials to connect to the LANDesk Core Server.

Basically if you can hit the MBSDK with a browser and login, you are good to go.
http://CoreServer/mbsdkservice/msgsdk.asmx

Visual Studio

  1. It is assumed that you have Visual Studio Professional installed

Step 1 – Create a Visual Studio Project

  1. In Visual Studio, Go to File | New | Project.
  2. Select that project type.
    Note: For this example I chose Console Application.
  3. Give the Project a name.
    Note: I named my project TalkToMBSDK.
  4. Click OK.
    Note: I went ahead and left my client application configured for .NET 4 even though I know the server currently is .NET 3.5 Sp1.

Step 2 – Add a Web Reference to the MBSDK

  1.  In you new Visual Studio project, right-click on the project and click Add Service Reference.
    Note: We actually need a Web  Reference but this is how we get there.
  2. Click Advanced on the bottom left.
  3. Click on Add Web Reference, also on the bottom left.
  4. Enter the URL to the MBSDK on your Core Server: http://CoreServer/mbsdkservice/msgsdk.asmx
  5. Change the Web Reference Name (on the right) to mbsdk.
    Note: You can name it whatever you want, but because there is an object called MBSDK (all uppercase), I chose to make the namespace mbsdk (all lowercase).
  6. Click Add Reference.

Step 3 – Test using the LANDesk SDK

  1. In the Program.cs add the following code.  You next steps are in the code comments.
using System.Net;
using TalkToMBSDK.mbsdk;

namespace TalkToMBSDK
{
    class Program
    {
        static void Main(string[] args)
        {
            // Step 1 - You need to use your credentials
            string user = "SomeUser";
            string password = "SomePassword";
            string domain = "SomeDomain.tld";

            // Step 2 - Configure a CredentialCache object with the URL and your creds
            string uri = "http://CoreServer/MBSDKService/MsgSDK.asmx";
            CredentialCache MyCredentialCache = new System.Net.CredentialCache();
            MyCredentialCache.Add(new System.Uri(uri), "NTLM", new NetworkCredential(user, password, domain));

            // Step 3 - Create an MBSDK object and set its CredentialCache object to the one you just created
            MBSDK sdk = new MBSDK();
            sdk.Credentials = MyCredentialCache;

            // Step 4 - Go ahead an call methods from the MBSDK
            // Note: If you get 401 unathorized, are you a LANDesk Administrator?
            string[] configs = sdk.GetClientConfigurations();
            DeviceList list = sdk.ListMachines("");
            string who = sdk.WhoAmI();
        }
    }
}

Have fun LANDesk Admins.