A basic reporting chart in ASP.NET
It is time to learn to write some charts. By charts I mean graphic views for reporting on data.
Obtaining MSChart
For .NET 4, MSChart is included in the .NET Framework, so if you have installed .NET 4, you have already obtained MSChart.
For .NET 3.5, the MSChart project which was an add-on. If you are using .NET 3.5, you need to download and install the add-on.
Note: I am using .NET 4 and it was installed with Visual Studio 2010, so I have no need to install the add-on.
Also, we are going to the very minimal steps manually. Many of these steps may be done for you (for example, the Visual Studio Designer will populate the Web.Config for you, but it is always good to know how do things yourself.
Report Example Use Case
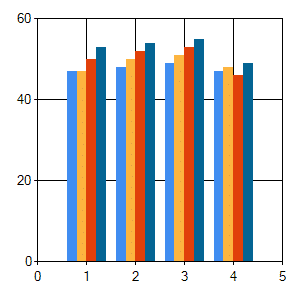
Imagine you have sales trending for four years, 2009-2012, and you want to visualize this trend. You want a chart that should all four years, with the quarter results next to each other.
Download the project here: SampleChart.zip
Step 1 – Create the Visual Studio project
- In Visual Studio, click on File | New | Project.
- Select Visual C# | Web from the Installed Templates.
- Locate and select ASP.NET Empty Web Application.
Note: I like to demonstrate using an Empty project you nothing is done for you, and you have to learn everything you actually need to do. - Give the project a name.
- Click OK.
- Right-click on the newly created project and click Add | Reference.
- Select the .NET tab.
- Locate System.Web.DataVisualization and highlight it.
- Click OK.
Step 2 – Add a web form for your chart
- Right-click on the Project and choose Add | New Item.
- Select Web Form.
- Give the file a name.
I named my file Report.aspx. - Click OK.
Step 3 – Create a data object for the report
- Right-click on the Project and choose Add | Class.
- Give the file a name.
I named my file Data.cs. - Click OK.
Step 4 – Add example data to the data object for the report
While in a real world scenario, you would get the data from a database or somewhere, lets first just create some sample data.
- Create a few lists of numbers, one for each year as shown.
namespace CompareYearsByQuarter
{
    public class Data
    {
        public int[] Sales2009 = new int[] { 47, 48, 49, 47 };
        public int[] Sales2010 = new int[] { 47, 50, 51, 48 };
        public int[] Sales2011 = new int[] { 50, 52, 53, 46 };
        public int[] Sales2012 = new int[] { 53, 54, 55, 49 };
    }
}
That is it, your fake example data is prepared.
Step 5 – Add a Chart to the Report.aspx file
- Open the Report.aspx file.
- Add a Register to the System.Web.DataVisualization assembly.
- Locate the div inside the body.
- Inside the div, add a Chart that includes a ChartArea.
<%@ Page Language="C#" AutoEventWireup="true" CodeBehind="Report.aspx.cs" Inherits="CompareYearsByQuarter.Report" %>

<%@ Register Assembly="System.Web.DataVisualization, Version=4.0.0.0, Culture=neutral, PublicKeyToken=31bf3856ad364e35"
    Namespace="System.Web.UI.DataVisualization.Charting" TagPrefix="asp" %>

<!DOCTYPE html PUBLIC "-//W3C//DTD XHTML 1.0 Transitional//EN" "http://www.w3.org/TR/xhtml1/DTD/xhtml1-transitional.dtd">
<html xmlns="http://www.w3.org/1999/xhtml">
<head runat="server">
    <title></title>
</head>
<body>
    <form id="form1" runat="server">
    <div>
        <asp:Chart ID="SalesReport" runat="server">
            <chartareas>
                <asp:ChartArea Name="ChartArea1">
                </asp:ChartArea>
            </chartareas>
        </asp:Chart>
    </div>
    </form>
</body>
</html>
Step 6 – Add code the Report.aspx.cs file
- Open the Report.aspx.cs file.
- Create an instance of the Data object that has our sample data.
- Add code in the Page_Load method to configure the Chart a separate series of data for each year.
using System;
using System.Collections.Generic;
using System.Linq;
using System.Web;
using System.Web.UI;
using System.Web.UI.WebControls;
using System.Web.UI.DataVisualization.Charting;

namespace CompareYearsByQuarter
{
    public partial class Report : System.Web.UI.Page
    {
        Data data = new Data();

        protected void Page_Load(object sender, EventArgs e)
        {
            Series year2009 = new Series("Sales 2009");
            // Populate new series with data
            foreach (var value in data.Sales2009)
            {
                year2009.Points.AddY(value);
            }
            SalesReport.Series.Add(year2009);

            Series year2010 = new Series("Sales 2010");
            // Populate new series with data
            foreach (var value in data.Sales2010)
            {
                year2010.Points.AddY(value);
            }
            SalesReport.Series.Add(year2010);

            Series year2011 = new Series("Sales 2011");
            // Populate new series with data
            foreach (var value in data.Sales2011)
            {
                year2011.Points.AddY(value);
            }
            SalesReport.Series.Add(year2011);

            Series year2012 = new Series("Sales 2012");
            // Populate new series with data
            foreach (var value in data.Sales2012)
            {
                year2012.Points.AddY(value);
            }
            SalesReport.Series.Add(year2012);
        }
    }
}
Step 7 – Add an http handler to the Web.Config for the Chart
- Open the Web.Config file.
- Add an http handler for the chart.
<?xml version="1.0"?>
<configuration>
  <system.web>
    <compilation debug="true" targetFramework="4.0" />
    <httpHandlers>
      <add path="ChartImg.axd" verb="GET,HEAD,POST" validate="false"
           type="System.Web.UI.DataVisualization.Charting.ChartHttpHandler, System.Web.DataVisualization, Version=4.0.0.0, Culture=neutral, PublicKeyToken=31bf3856ad364e35" />
    </httpHandlers>
  </system.web>
</configuration>
You are done. Build and look at your report.
You now have a simple report that should show you the sales trend for quarters 1,2,3,4 over four years. Your chart should look like this.
Download the project here: SampleChart.zip


Hi,
I need to create a organization chart using MS Charts and ASP.NET/ C#, Can you please help me to create an organization chart?
Thanks in advance.
Regards
Saravanan K