Archive for the ‘ASP.NET’ Category.

Configuring Visual Studio to open the browser InPrivate or Incognito

Sometimes, when coding a web application in visual studio, you may want to have the project start in an InPrivate or Incognito window. Browsers, such as Chrome, Edge, Firefox, and others, have a special way to open them that is clean as in no cookies or history or logins and it isn’t tied to your normal browser session. This is called Private browsing. They each brand it a little differently, with Edge being InPrivate and Chrome using Incognito, but they are all private browsing.

Visual Studio can easily be configured to open the browser in private browsing.

Configure Visual Studio to Launch the Browser in Private Mode

  1. Open Visual Studio
  2. Locate your Asp.Net Application and open it
    or
    Create a new Asp.Net Project (you can throw away this project afterward)
  3. Once the project is open, locate the Debug Target icon, which is a green triangle that looks like a start icon:
  4. Click the drop-down arrow just to the right of it.
  5. Select Browse with:
  6. In the Browse With screen, click Add.
  7. Enter one or more of these values: (I entered both)

    Edge
    Program: C:\Program Files (x86)\Microsoft\Edge\Application\msedge.exe
    Arguments: -InPrivate
    Friendly Name: Edge (InPrivate)

    Chrome
    Program: C:\Program Files\Google\Chrome\Application\chrome.exe
    Arguments: -incognito
    Friendly Name: Google Chrome (Incognito)

  8. Click OK.
  9. Now you can change the default if you desire.
    My default was set to Edge.

    To change the default, highlight the desired browser setting and click Set as Default button.
  10. Click Browse and your app will start in debugging and browse to the local url with your configured default browser.

Happy coding!


Aspx CheckBoxList Alternative that allows for the OnCheckedChanged event

My team had to edit an older apsx website and add a list of CheckBoxes, which are actually html <input type="checkbox"/> tags.  We assumed that CheckBoxList would be perfect for our task. We assumed wrong.

I wrote desktop apps for years and now that I am writing web apps, I am using MVC and Razor, so I missed the aspx days. However, having to work on legacy aspx applications is catching me up.

My use case for list of CheckBoxes

Really, my use case is simple. There are icons that should show up for some products. We wanted to store a map between products and the icons in the database. On the product page, we want a list of the icons with a checkbox by each list item. This would allow the person who creates new products to select which icons to show on a product download page.

  1. Get a list of option from a database and display that list as html checkboxes.
  2. Checking a checkbox should add a row to a database table.
  3. Unchecking a checkbox should remove that row from a database table.

CheckBoxList Fails

So what I needed was an OnClick event which is actually called OnCheckedChanged in an asp:Checkbox. Well, it turns out that the CheckBoxList control doesn’t support the OnCheckedChanged event per CheckBox. The CheckBoxList doesn’t have any type of OnClick method. Instead, there is an OnSelectedIndexChanged event. But OnSelectedIndexChanged doesn’t even tell you which CheckBox was clicked. If a CheckBox is checked, then in the OnSelectedIndexChanged event, the SelectedItem equals the clicked item, however, if the CheckBox is unchecked, the SelectedItem was a completely different CheckBox that is checked.

So to me, this made the CheckBoxList control not usable. So I set out to replicate a CheckBoxList in a way that supports OnCheckedChanged.

Repeater with CheckBox for ItemTemplate

I ended up using the Repeater control with an ItemTemplate containing a CheckBox. Using this method worked pretty much flawlessly. It leaves me to wonder, why was CheckBoxList created in the first place if a Repeater with a CheckBox in the template works perfectly well.

Here is my code:

<%@ Page Title="Home Page" Language="C#" MasterPageFile="~/Site.Master" AutoEventWireup="true" CodeBehind="Default.aspx.cs" Inherits="CheckBoxListExample._Default" %>

<%@ Import Namespace="CheckBoxListExample" %>
<%@ Import Namespace="CheckBoxListExample.Models" %>

<asp:Content ID="BodyContent" ContentPlaceHolderID="MainContent" runat="server">
    <div>
        <asp:Repeater ID="Repeater1" runat="server">
            <ItemTemplate>
                <asp:CheckBox ID="cb1" runat="server" AutoPostBack="true" OnCheckedChanged="RepeaterCheckBoxChanged"
                    Text="<%# ((CheckBoxViewModel)Container.DataItem).Name %>"
                    Checked="<%# ((CheckBoxViewModel)Container.DataItem).IsChecked %>" />
            </ItemTemplate>
        </asp:Repeater>
    </div>
</asp:Content>
using System;
using System.Collections.Generic;
using System.Web.UI;
using System.Web.UI.WebControls;
using CheckBoxListExample.Models;

namespace CheckBoxListExample
{
    public partial class _Default : Page
    {
        private List<CheckBoxViewModel> _ViewModels;

        protected void Page_Load(object sender, EventArgs e)
        {
            if (!IsPostBack)
            {
                var _ViewModels = new List<CheckBoxViewModel>
                {
                    new CheckBoxViewModel {Name = "Test1", IsChecked = true},
                    new CheckBoxViewModel {Name = "Test2"},
                    new CheckBoxViewModel {Name = "Test3"}
                };
                Repeater1.DataSource = _ViewModels;
                Repeater1.DataBind();
            }
        }

        protected void RepeaterCheckBoxChanged(object sender, EventArgs e)
        {
            var cb = sender as CheckBox;
            if (cb == null) return;
            if (cb.Checked)
            {
                // Insert
            }
            else
            {
                // Delete
            }
        }
    }
}
namespace CheckBoxListExample.Models
{
    public class CheckBoxViewModel
    {
        public string Name { get; set; }
        public bool IsChecked { get; set; }
    }
}

Removing the namespace from the ConnectionString name in the web.config

So we are working on moving a legacy web site to MVC4.  Yes, it is my first time doing this.  I encountered an annoying issue that I thought worth blogging about.

Ok, so I have a DLL that is pretty much nothing more than a TableAdapter. (Yes, I wish this legacy project was using Entity Framework, but alas, it is not). I have a config file and the connectionstring name has a the mode horrible namespace.

  <connectionStrings>
    <add name="Company.Division.Feature.DataAccessLayer.MyConnectionString" connectionString="Data Source=MyServer;Initial Catalog=MyDatabase;Persist Security Info=True;User ID=MyUser;Password=MyPasswd" providerName="System.Data.SqlClient" />
    <add name="MyConnectionString" connectionString="Data Source=MyServer;Initial Catalog=MyDatabase;Persist Security Info=True;User ID=MyUser;Password=MyPasswd" providerName="System.Data.SqlClient" />
  </connectionStrings>

Seriously: Company.Division.Feature.DataAccessLayer.MyConnectionString.

Yes, the same connection string is listed twice, once with the namespace and once without.

Why? Well, because all throughout the code, the original authors make call this:

ConfigurationManager.ConnectionStrings["WavelinkLMConnectionString"].ConnectionString

I would like to get rid of one of these configuration settings. Obviously to me, it makes sense to get rid of the long one.

So why doesn’t my TableAdapter library project use the shorter table adapter. Well, I figured that out. Because it is in the Settings file and the Settings file looks for the value using the namespace.

Look at this Settings.Designer.cs file

//------------------------------------------------------------------------------
// <auto-generated>
//     This code was generated by a tool.
//     Runtime Version:4.0.30319.18051
//
//     Changes to this file may cause incorrect behavior and will be lost if
//     the code is regenerated.
// </auto-generated>
//------------------------------------------------------------------------------

namespace Company.Division.Feature.DataAccessLayer.Properties {
    
    
    [global::System.Runtime.CompilerServices.CompilerGeneratedAttribute()]
    [global::System.CodeDom.Compiler.GeneratedCodeAttribute("Microsoft.VisualStudio.Editors.SettingsDesigner.SettingsSingleFileGenerator", "11.0.0.0")]
    internal sealed partial class Settings : global::System.Configuration.ApplicationSettingsBase {
        
        private static Settings defaultInstance = ((Settings)(global::System.Configuration.ApplicationSettingsBase.Synchronized(new Settings())));
        
        public static Settings Default {
            get {
                return defaultInstance;
            }
        }
        
        [global::System.Configuration.ApplicationScopedSettingAttribute()]
        [global::System.Diagnostics.DebuggerNonUserCodeAttribute()]
        [global::System.Configuration.SpecialSettingAttribute(global::System.Configuration.SpecialSetting.ConnectionString)]
        [global::System.Configuration.DefaultSettingValueAttribute("Data Source=MyServer;Initial Catalog=MyDatabase;Persist Security Info=True;User ID=MyUser;Password=MyPasswd")]
        public string MyConnectionString{
            get {
                return ((string)(this["MyConnectionString"]));
            }
        }
    }
}

OK, so every single TableAdapter requires this value, so I can’t remove it. I could change it but then everytime the settings regenerated this file, I would have to recreate teh change. Not a good idea.

Hooray for partial classes! To fix this, I removed this setting and put it in a separate partial class. In fact, I learned that in the Settings UI, you can click View Code and it will create this file for you. But for me it created in the project root and not under the Properties solution folder, so I had to move it under Properties myself.

using System.Configuration;
using System.Diagnostics;

namespace Company.Division.Feature.DataAccessLayer.Properties
{
    internal sealed partial class Settings
    {
        [ApplicationScopedSetting]
        [DebuggerNonUserCode]
        [SpecialSetting(SpecialSetting.ConnectionString)]
        [global::System.Configuration.DefaultSettingValueAttribute("Data Source=MyServer;Initial Catalog=MyDatabase;Persist Security Info=True;User ID=MyUser;Password=MyPasswd")]
        public string MyConnectionString
        {
            get
            {
                if (!string.IsNullOrWhiteSpace(ConfigurationManager.ConnectionStrings["MyConnectionString"].ConnectionString))
                    this["MyConnectionString"] = ConfigurationManager.ConnectionStrings["MyConnectionString"].ConnectionString;
                return (string)this["MyConnectionString"];
            }
        }
    }
}

As you can see, I just check if the value is set in the config file without the namespace. If it is, I set the setting to that value.

And that is it! I now can make my config have a single connection string and I don’t have to include the namespace!

  <connectionStrings>
    <add name="MyConnectionString" connectionString="Data Source=MyServer;Initial Catalog=MyDatabase;Persist Security Info=True;User ID=MyUser;Password=MyPasswd" providerName="System.Data.SqlClient" />
  </connectionStrings>

Creating a drill down chart with ASP.NET and MSChart

In my first post, A basic reporting chart in ASP.NET, I went over the basics of creating a report using MSChart and ASP.NET and this was quit easy. However, in today’s world where the importance of business intelligence is ever increasing, the ability to drill down on a report has become the de facto standard. MSChart, ASP.NET, and HTML make it easy to create a drill-down report.

Note: Microsoft has a drill-down report in their ChartSamples example, but it was bundled as part of the same project with two-hundred other reports and was not a minimal example. It requires the use of an Access database (and I had nothing to read Access with), it has a bunch of javascript code that is for a tooltip preview of the drill down report, and the charts are in two objects. All of this made it more difficult for me to break this down.  In this example, the report will be its own ASP.NET project and will be a minimal example, however the use case and the sample data is taken directly from Microsoft’s example.

Report Example Use Case

Imagine you have a list of sales reps, their regions, and their sales results. You want a report to look at total sales per region. Then you want to click on a region to the see the sales by sales rep.

Download the project here: SampleChart.zip

Step 1 – Create the Visual Studio project

  1. In Visual Studio, click on File | New | Project.
  2. Select Visual C# | Web from the Installed Templates.
  3. Locate and select ASP.NET Empty Web Application.
    Note: I like to demonstrate using an Empty project you nothing is done for you, and you have to learn everything you actually need to do.
  4. Give the project a name.
    I named mine DrillDownChart because that is my example’s purpose.
  5. Click OK.
  6. Right-click on the newly created project and click Add | Reference.
  7. Select the .NET tab.
  8. Locate System.Web.DataVisualization and highlight it.
  9. Click OK.

Step 2 – Add a web form for your chart

  1. Right-click on the Project and choose Add |  New Item.
  2. Select Web Form.
  3. Give the file a name.
    I named my file  Report.aspx.
  4. Click OK.

Step 3 – Create a data object for the report

Because data is often coming from a database, this example is going to use a DataSet. I am not going to connect to a database, but just use a statically build DataSet.

  1. Right-click on the Project and choose Add |  Class.
  2. Give the file a name.
    I named my file  SalesDataSet.cs.
  3. Make the class inherit from DataSet.
  4. Click OK.

Step 4 – Add example data to the data object for the report

While in a real world scenario, you would get the data from a database or somewhere, lets first just create some sample data. We are going to create two simple tables. One is a Region table, that has the region name and ID. One is a RepSales table that has sales per rep and the rep’s region id.

  1. Create a property with only a getter that creates a region DataTable called RegionTable.
  2. Add the columns needed: RegionID and RegionName.
  3. Add the appropriate rows.
  4. Create a property with only a getter that creates a reps sales DataTable called RepsSalesTable.
  5. Add the columns needed: ID, Name, RegionID, and Sales.
  6. Add the appropriate rows.
  7. Now in your constructor, add those to the list of Tables in your object.
    using System;
    using System.Collections.Generic;
    using System.Linq;
    using System.Web;
    using System.Data;
    
    namespace DrillDownChart
    {
        public class SalesDataSet : DataSet
        {
            public SalesDataSet()
            {
                Tables.Add(RegionTable);
                Tables.Add(RepsSalesTable);
    
            }
    
            public DataTable RegionTable
            {
                get
                {
                    if (_RegionTable == null)
                    {
                        List<String> Regions = new List<string>() { "East", "West", "Central", "International", "South" };
    
                        _RegionTable = new DataTable("Region");
                        _RegionTable.Columns.Add("RegionID", typeof(int));
                        _RegionTable.Columns.Add("RegionName", typeof(string));
    
                        int i = 0;
                        foreach (var region in Regions)
                        {
                            DataRow row = _RegionTable.NewRow();
                            row["RegionID"] = ++i;
                            row["RegionName"] = region;
                            _RegionTable.Rows.Add(row);
                        }
    
                    }
                    return _RegionTable;
                }
            } private DataTable _RegionTable;
    
            public DataTable RepsSalesTable
            {
                get
                {
                    if (_RepsSalesTable == null)
                    {
                        List<String> reps = new List<string>() {
                            "Aaron", "Larry", "Andrew", "Mary", "Sally", "Nguyen", "Francis",
                            "Jerry", "Danny", "Jim", "Sarah", "Hannah", "Kim", "Gerry", "Bob" };
                        int[] regions = { 1, 2, 3, 1, 4, 2, 4, 3, 1, 2, 2, 3, 5, 5, 5 };
                        int[] sales = { 10440, 17772, 23880, 7663, 21773, 32294, 11983, 14991,
                                        17946, 8551, 19443, 27887, 30332, 16668, 21225 };
    
                        _RepsSalesTable = new DataTable("RepsSales");
                        _RepsSalesTable.Columns.Add("ID", typeof(int));
                        _RepsSalesTable.Columns.Add("Name", typeof(string));
                        _RepsSalesTable.Columns.Add("RegionID", typeof(int));
                        _RepsSalesTable.Columns.Add("Sales", typeof(int));
    
                        for (int i = 0; i < reps.Count; i++)
                        {
                            DataRow row = _RepsSalesTable.NewRow();
                            row["ID"] = i + 1;
                            row["Name"] = reps[i];
                            row["RegionID"] = regions[i];
                            row["Sales"] = sales[i];
    
                            _RepsSalesTable.Rows.Add(row);
                        }
    
                    }
                    return _RepsSalesTable;
                }
            } private DataTable _RepsSalesTable;
        }
    }
    

That is it, your fake example data is prepared.

Step 5 – Add a Chart to the Report.aspx file

  1. Open the Report.aspx file.
  2. Add a Register to the System.Web.DataVisualization assembly.
  3. Locate the div inside the body.
  4. Inside the div, add a Chart that includes a ChartArea.
    <%@ Page Language="C#" AutoEventWireup="true" CodeBehind="Report.aspx.cs" Inherits="CompareYearsByQuarter.Report" %>
    
    <%@ Register Assembly="System.Web.DataVisualization, Version=4.0.0.0, Culture=neutral, PublicKeyToken=31bf3856ad364e35"
        Namespace="System.Web.UI.DataVisualization.Charting" TagPrefix="asp" %>
    
    <!DOCTYPE html PUBLIC "-//W3C//DTD XHTML 1.0 Transitional//EN" "http://www.w3.org/TR/xhtml1/DTD/xhtml1-transitional.dtd">
    <html xmlns="http://www.w3.org/1999/xhtml">
    <head runat="server">
        <title></title>
    </head>
    <body>
        <form id="form1" runat="server">
        <div>
            <asp:Chart ID="SalesReport" runat="server">
                <chartareas>
                    <asp:ChartArea Name="ChartArea1">
                    </asp:ChartArea>
                </chartareas>
            </asp:Chart>
        </div>
        </form>
    </body>
    </html>
    

Step 6 – Add code the Report.aspx.cs file

We are going to use the same object for both the original report and the drill down report. We will just a little code that switches which data the chart is populated with.

  1. Open the Report.aspx.cs file.
  2. Create an instance of the SalesDataSet object that has our sample data.
  3. Add code in the Page_Load method to configure the Chart.
    Note 1: The steps for this code is in the code and comments itself. I created a method for each step and then populated the methods as  needed.
    Note 2: Notice that the AddDataToSeries() method uses and if statement to determine whether to add the original data or the drill down data.
    Note 3: Because we used a DataTable we query the example data using LINQ. It is likely that in your production reports you are using a real database and you will probably use queries directly to your database.

    using System;
    using System.Collections.Generic;
    using System.Linq;
    using System.Web;
    using System.Web.UI;
    using System.Web.UI.WebControls;
    using System.Data;
    using System.Web.UI.DataVisualization.Charting;
    
    namespace DrillDownChart
    {
        public partial class RegionReport : System.Web.UI.Page
        {
            // Step 1 - Create Example Data
            SalesDataSet ExampleData = new SalesDataSet();
    
            protected void Page_Load(object sender, EventArgs e)
            {
                // Step 2 - Populate chart drop down
                PopulateChartTypeDropDown();
    
                // Step 3 - Create Series
                Series series = CreateSeries();
    
                // Step 4 - Set the chart type
                SetChartType(series);
    
                // Step 5 - Add data (and if needed drilldown links to series)
                AddDataToSeries(series);
    
                // Step 6 - Add series into the chart's series collection
                SalesReport.Series.Add(series);
            }
    
            private void PopulateChartTypeDropDown()
            {
                List<String> chartTypes = new List<String>(Enum.GetNames(typeof(SeriesChartType)));
                chartTypes.Insert(0, "");
    
                foreach (var item in chartTypes)
                {
                    DropDownListChartType.Items.Add(item);
                }
            }
    
            private Series CreateSeries()
            {
                Series series = new Series("Sales");
                series.BorderWidth = 3;
                series.ShadowOffset = 2;
                return series;
            }
    
            private void SetChartType(Series inSeries)
            {
                if (Page.Request["ChartType"] != null)
                    DropDownListChartType.SelectedValue = Page.Request["ChartType"];
    
                if (DropDownListChartType.SelectedValue.ToString() == "")
                    DropDownListChartType.SelectedValue = SeriesChartType.Column.ToString();
    
                inSeries.ChartType = (SeriesChartType)System.Enum.Parse(typeof(SeriesChartType), DropDownListChartType.SelectedValue.ToString());
            }
    
            private void AddDataToSeries(Series series)
            {
                if (Page.Request["ChartType"] == null)
                    AddAllRegionData(series);
                else
                    AddSpecificRegionData(series);
            }
    
            private void AddAllRegionData(Series series)
            {
                DataTable sales = ExampleData.Tables["RepsSales"];
                DataTable regions = ExampleData.Tables["Region"];
    
                var query = from reps in sales.AsEnumerable()
                            join region in regions.AsEnumerable()
                            on reps.Field<int>("RegionID") equals region.Field<int>("RegionID")
                            group reps by region.Field<string>("RegionName") into regionGroup
                            select new { Region = regionGroup.Key, Sales = regionGroup.Sum(total => total.Field<int>("Sales")) };
    
                // Populate new series with data
                foreach (var value in query)
                {
                    series.Points.AddXY(value.Region, value.Sales);
                }
    
                // Step 7 - Make this series drillable
                for (int i = 0; i < series.Points.Count; i++)
                {
                    series.Points[i].Url = string.Format("RegionReport.aspx?region={0}&ChartType={1}", series.Points[i].AxisLabel, DropDownListChartType.SelectedValue);
                }
            }
    
            private void AddSpecificRegionData(Series series)
            {
                var query = from reps in ExampleData.RepsSalesTable.AsEnumerable()
                            join region in ExampleData.RegionTable.AsEnumerable()
                            on reps.Field<int>("RegionID") equals region.Field<int>("RegionID")
                            where region.Field<string>("RegionName") == (Page.Request["Region"] ?? "East")
                            select new { RepName = reps.Field<string>("Name"), Sales = reps.Field<int>("Sales") };
    
                // Populate new series with data
                foreach (var value in query)
                {
                    series.Points.AddXY(value.RepName, value.Sales);
                }
    
                // Step 7 - Make this series drillable
                for (int i = 0; i < series.Points.Count; i++)
                //{
                //    // Add drill down code to drill to a third chart
                //}
            }
    
            private void AddDrillDown(Series series)
            {
                for (int i = 0; i < series.Points.Count; i++)
                {
                    series.Points[i].Url = string.Format("RegionReport.aspx?region={0}&ChartType={1}", series.Points[i].AxisLabel, DropDownListChartType.SelectedValue);
                }
            }
        }
    }
    

Step 7 – Add an http handler to the Web.Config for the Chart

  1. Open the Web.Config file.
  2. Add an http handler for the chart.
<?xml version="1.0"?>
<configuration>
  <system.web>
    <compilation debug="true" targetFramework="4.0" />
    <httpHandlers>
      <add path="ChartImg.axd" verb="GET,HEAD,POST" validate="false"
           type="System.Web.UI.DataVisualization.Charting.ChartHttpHandler, System.Web.DataVisualization, Version=4.0.0.0, Culture=neutral, PublicKeyToken=31bf3856ad364e35" />
    </httpHandlers>
  </system.web>
</configuration>

Your project is now complete.

You now have a report that shows you the total sales per region.

Click on the report and you have the sales per region broken out by sales rep.

And your done.

Download the project here: SampleChart.zip

A basic reporting chart in ASP.NET

It is time to learn to write some charts. By charts I mean graphic views for reporting on data.

Obtaining MSChart

For .NET 4, MSChart is included in the .NET Framework, so if you have installed .NET 4, you have already obtained MSChart.

For .NET 3.5, the MSChart project which was an add-on. If you are using .NET 3.5, you need to download and install the add-on.

Note: I am using .NET 4 and it was installed with Visual Studio 2010, so I have no need to install the add-on.

Also, we are going to the very minimal steps manually. Many of these steps may be done for you (for example, the Visual Studio Designer will populate the Web.Config for you, but it is always good to know how do things yourself.

Report Example Use Case

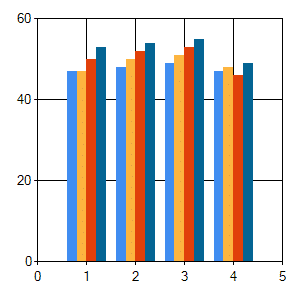
Imagine you have sales trending for four years, 2009-2012, and you want to visualize this trend. You want a chart that should all four years, with the quarter results next to each other.

Download the project here: SampleChart.zip

Step 1 – Create the Visual Studio project

  1. In Visual Studio, click on File | New | Project.
  2. Select Visual C# | Web from the Installed Templates.
  3. Locate and select ASP.NET Empty Web Application.
    Note: I like to demonstrate using an Empty project you nothing is done for you, and you have to learn everything you actually need to do.
  4. Give the project a name.
  5. Click OK.
  6. Right-click on the newly created project and click Add | Reference.
  7. Select the .NET tab.
  8. Locate System.Web.DataVisualization and highlight it.
  9. Click OK.

Step 2 – Add a web form for your chart

  1. Right-click on the Project and choose Add |  New Item.
  2. Select Web Form.
  3. Give the file a name.
    I named my file  Report.aspx.
  4. Click OK.

Step 3 – Create a data object for the report

  1. Right-click on the Project and choose Add |  Class.
  2. Give the file a name.
    I named my file  Data.cs.
  3. Click OK.

Step 4 – Add example data to the data object for the report

While in a real world scenario, you would get the data from a database or somewhere, lets first just create some sample data.

  1. Create a few lists of numbers, one for each year as shown.
    namespace CompareYearsByQuarter
    {
        public class Data
        {
            public int[] Sales2009 = new int[] { 47, 48, 49, 47 };
            public int[] Sales2010 = new int[] { 47, 50, 51, 48 };
            public int[] Sales2011 = new int[] { 50, 52, 53, 46 };
            public int[] Sales2012 = new int[] { 53, 54, 55, 49 };
        }
    }
    

That is it, your fake example data is prepared.

Step 5 – Add a Chart to the Report.aspx file

  1. Open the Report.aspx file.
  2. Add a Register to the System.Web.DataVisualization assembly.
  3. Locate the div inside the body.
  4. Inside the div, add a Chart that includes a ChartArea.
    <%@ Page Language="C#" AutoEventWireup="true" CodeBehind="Report.aspx.cs" Inherits="CompareYearsByQuarter.Report" %>
    
    <%@ Register Assembly="System.Web.DataVisualization, Version=4.0.0.0, Culture=neutral, PublicKeyToken=31bf3856ad364e35"
        Namespace="System.Web.UI.DataVisualization.Charting" TagPrefix="asp" %>
    
    <!DOCTYPE html PUBLIC "-//W3C//DTD XHTML 1.0 Transitional//EN" "http://www.w3.org/TR/xhtml1/DTD/xhtml1-transitional.dtd">
    <html xmlns="http://www.w3.org/1999/xhtml">
    <head runat="server">
        <title></title>
    </head>
    <body>
        <form id="form1" runat="server">
        <div>
            <asp:Chart ID="SalesReport" runat="server">
                <chartareas>
                    <asp:ChartArea Name="ChartArea1">
                    </asp:ChartArea>
                </chartareas>
            </asp:Chart>
        </div>
        </form>
    </body>
    </html>
    

Step 6 – Add code the Report.aspx.cs file

  1. Open the Report.aspx.cs file.
  2. Create an instance of the Data object that has our sample data.
  3. Add code in the Page_Load method to configure the Chart a separate series of data for each year.
    using System;
    using System.Collections.Generic;
    using System.Linq;
    using System.Web;
    using System.Web.UI;
    using System.Web.UI.WebControls;
    using System.Web.UI.DataVisualization.Charting;
    
    namespace CompareYearsByQuarter
    {
        public partial class Report : System.Web.UI.Page
        {
            Data data = new Data();
    
            protected void Page_Load(object sender, EventArgs e)
            {
                Series year2009 = new Series("Sales 2009");
                // Populate new series with data
                foreach (var value in data.Sales2009)
                {
                    year2009.Points.AddY(value);
                }
                SalesReport.Series.Add(year2009);
    
                Series year2010 = new Series("Sales 2010");
                // Populate new series with data
                foreach (var value in data.Sales2010)
                {
                    year2010.Points.AddY(value);
                }
                SalesReport.Series.Add(year2010);
    
                Series year2011 = new Series("Sales 2011");
                // Populate new series with data
                foreach (var value in data.Sales2011)
                {
                    year2011.Points.AddY(value);
                }
                SalesReport.Series.Add(year2011);
    
                Series year2012 = new Series("Sales 2012");
                // Populate new series with data
                foreach (var value in data.Sales2012)
                {
                    year2012.Points.AddY(value);
                }
                SalesReport.Series.Add(year2012);
            }
        }
    }
    

Step 7 – Add an http handler to the Web.Config for the Chart

  1. Open the Web.Config file.
  2. Add an http handler for the chart.
<?xml version="1.0"?>
<configuration>
  <system.web>
    <compilation debug="true" targetFramework="4.0" />
    <httpHandlers>
      <add path="ChartImg.axd" verb="GET,HEAD,POST" validate="false"
           type="System.Web.UI.DataVisualization.Charting.ChartHttpHandler, System.Web.DataVisualization, Version=4.0.0.0, Culture=neutral, PublicKeyToken=31bf3856ad364e35" />
    </httpHandlers>
  </system.web>
</configuration>

You are done. Build and look at your report.

You now have a simple report that should show you the sales trend for quarters 1,2,3,4 over four years. Your chart should look like this.

Download the project here: SampleChart.zip